The chart edit panel gives you full control over how a chart looks and how users interact with it. You can update styling, link charts together, and configure drill behaviours — all without regenerating your dashboard.Documentation Index
Fetch the complete documentation index at: https://docs.ideaboxai.com/llms.txt
Use this file to discover all available pages before exploring further.
Opening the edit panel
Click Open Edit Panel from the chart context menu, or enter Edit mode on the dashboard and select the chart you want to modify.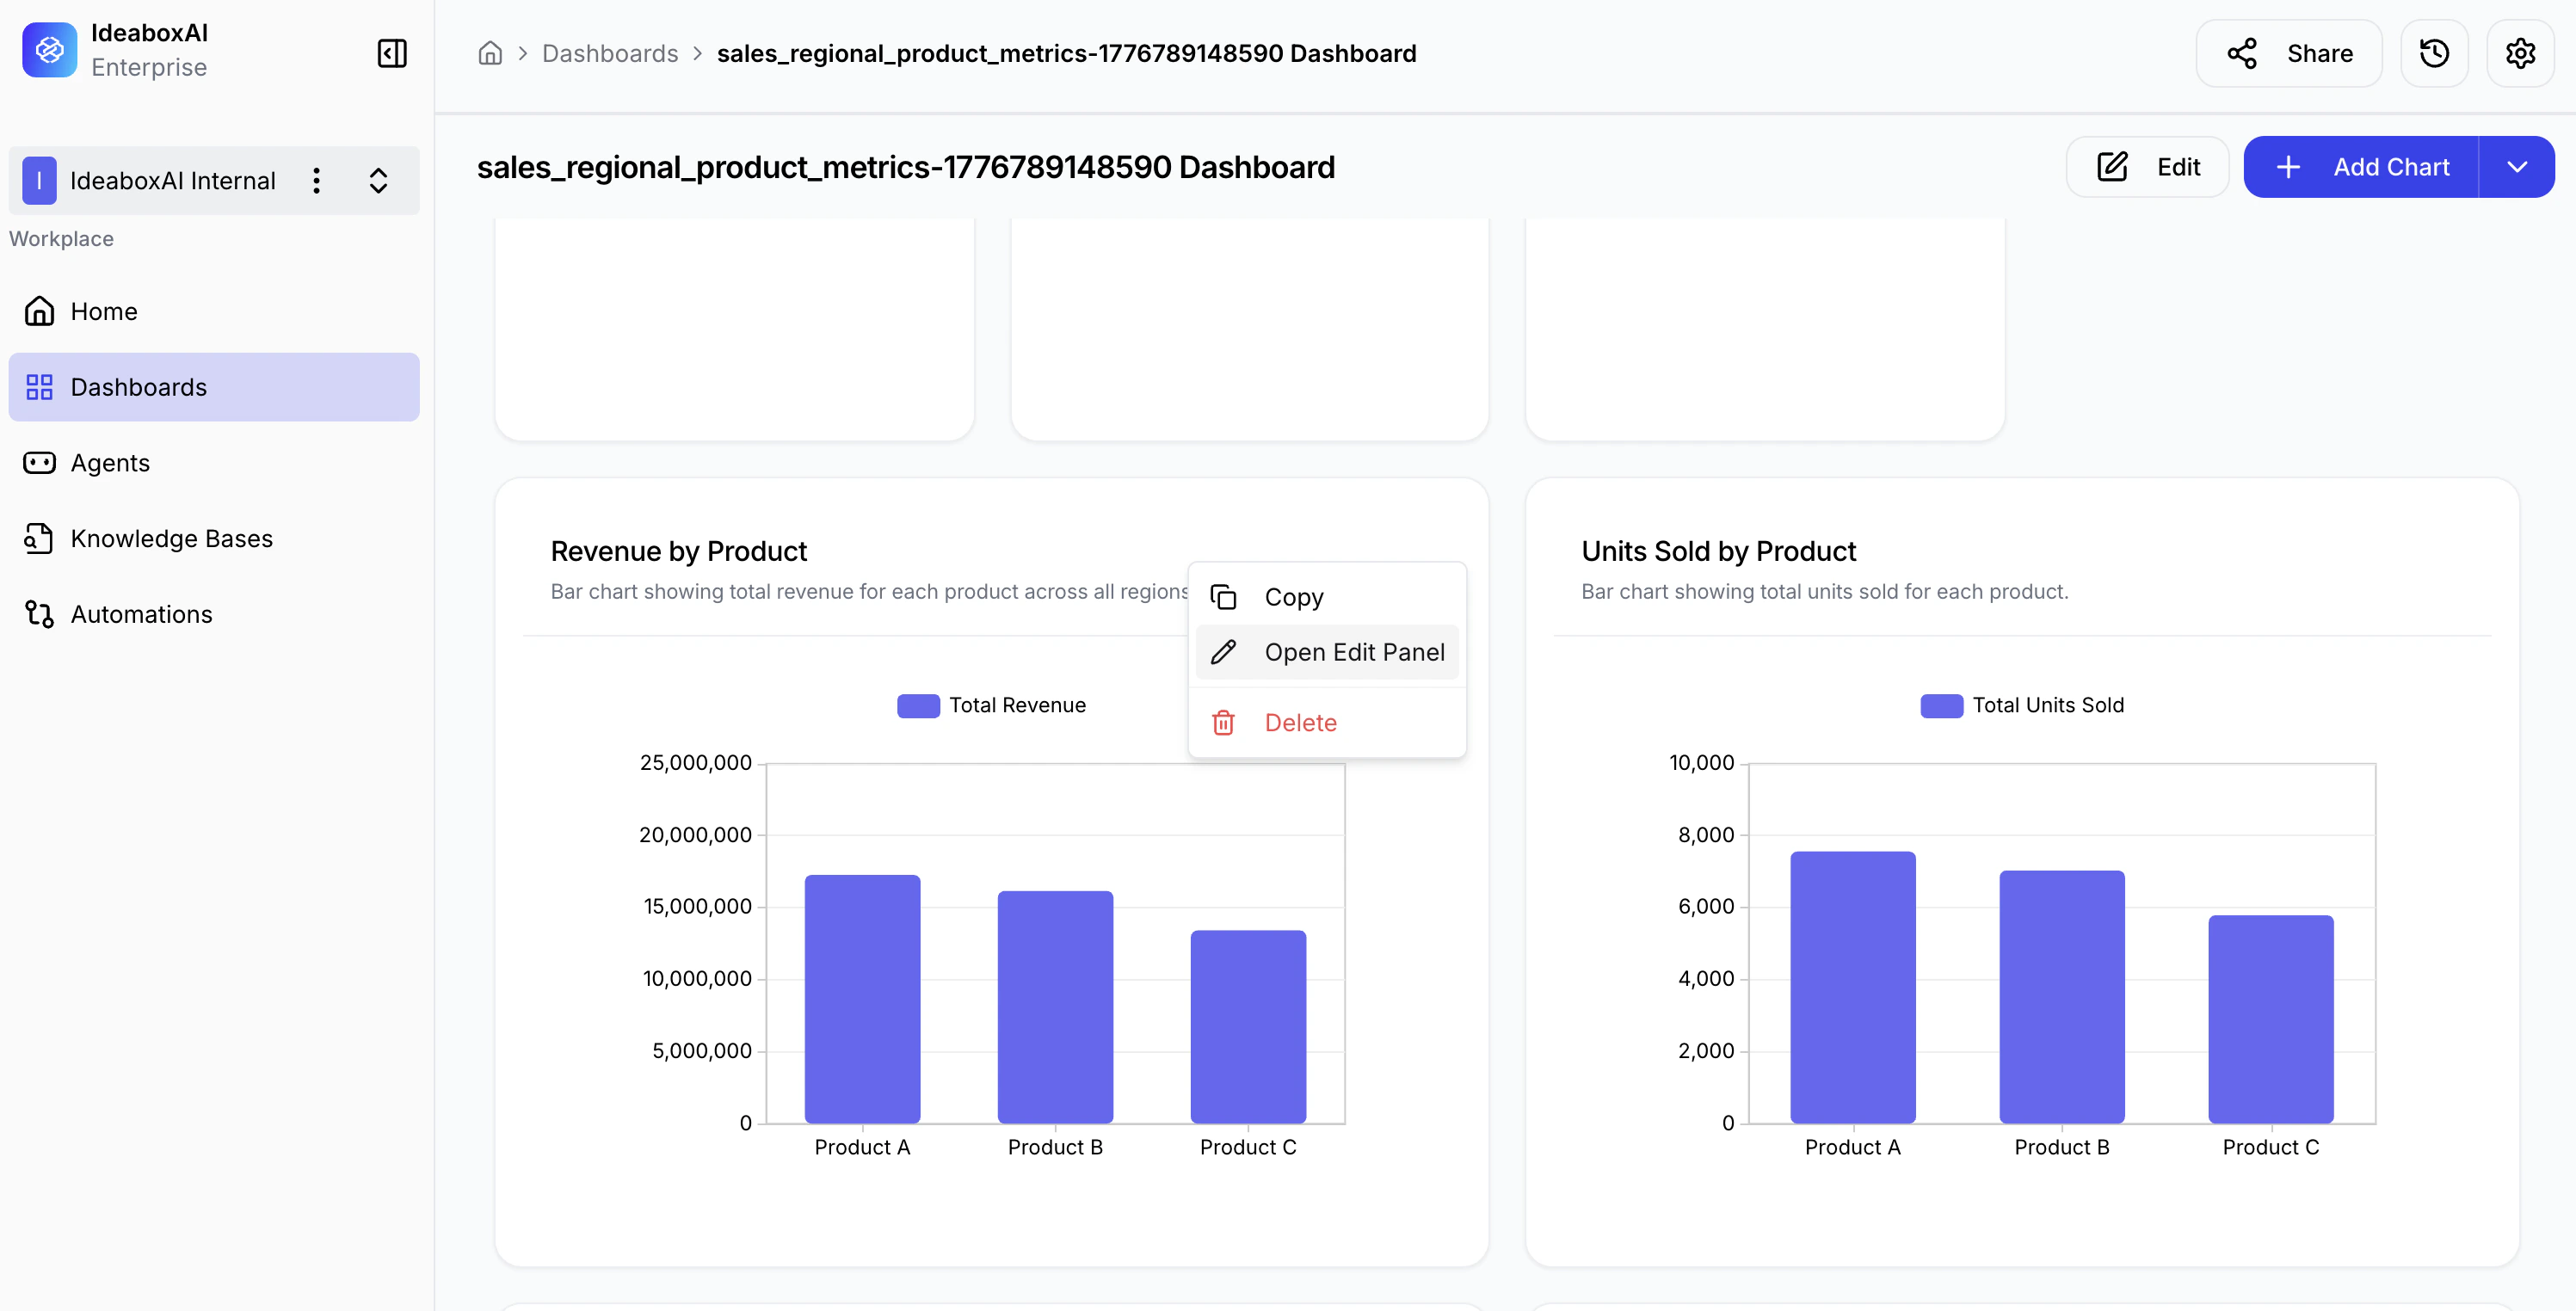
Appearance
Customise the visual presentation of your chart.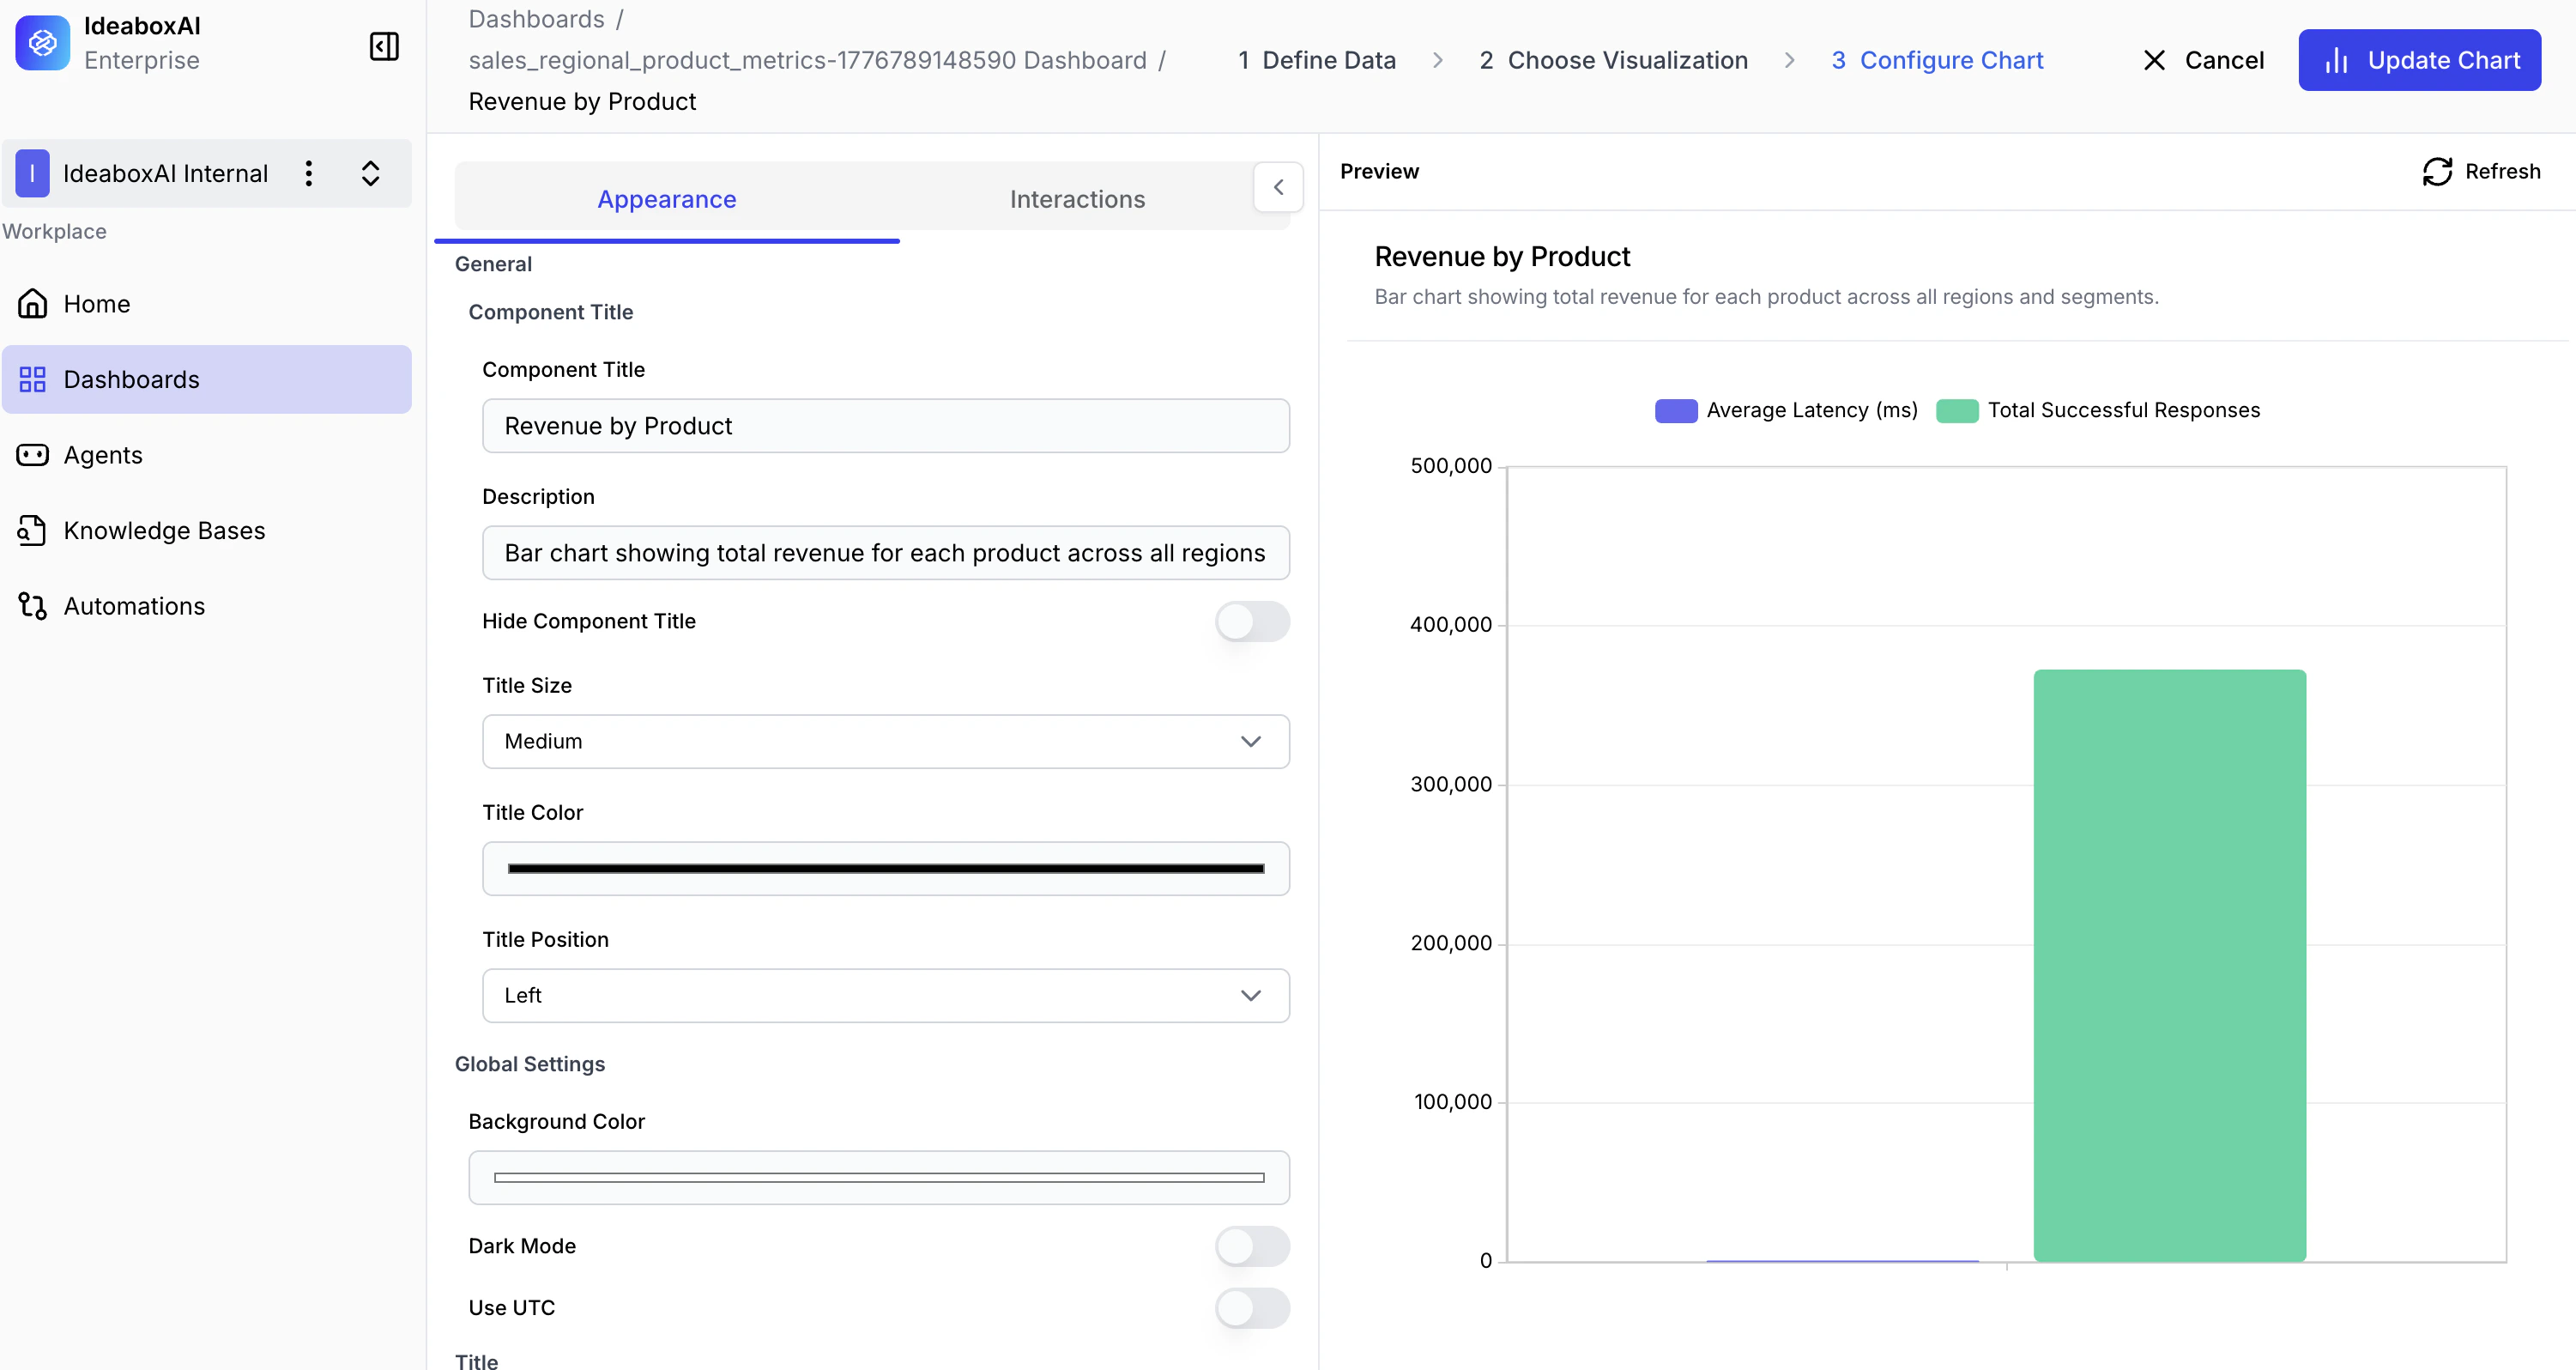
| Setting | Description |
|---|---|
| Chart Title | Add or modify the name displayed above the chart. |
| Colors | Change color schemes and individual element colors. |
| Fonts | Adjust font size, style, and weight for readability. |
| Number Formatting | Set decimal places, currency symbols, and thousands separators. |
| Value Units | Display values in thousands (K), millions (M), or billions (B). |
Interactions
Enable users to explore data dynamically. Four interaction types are available.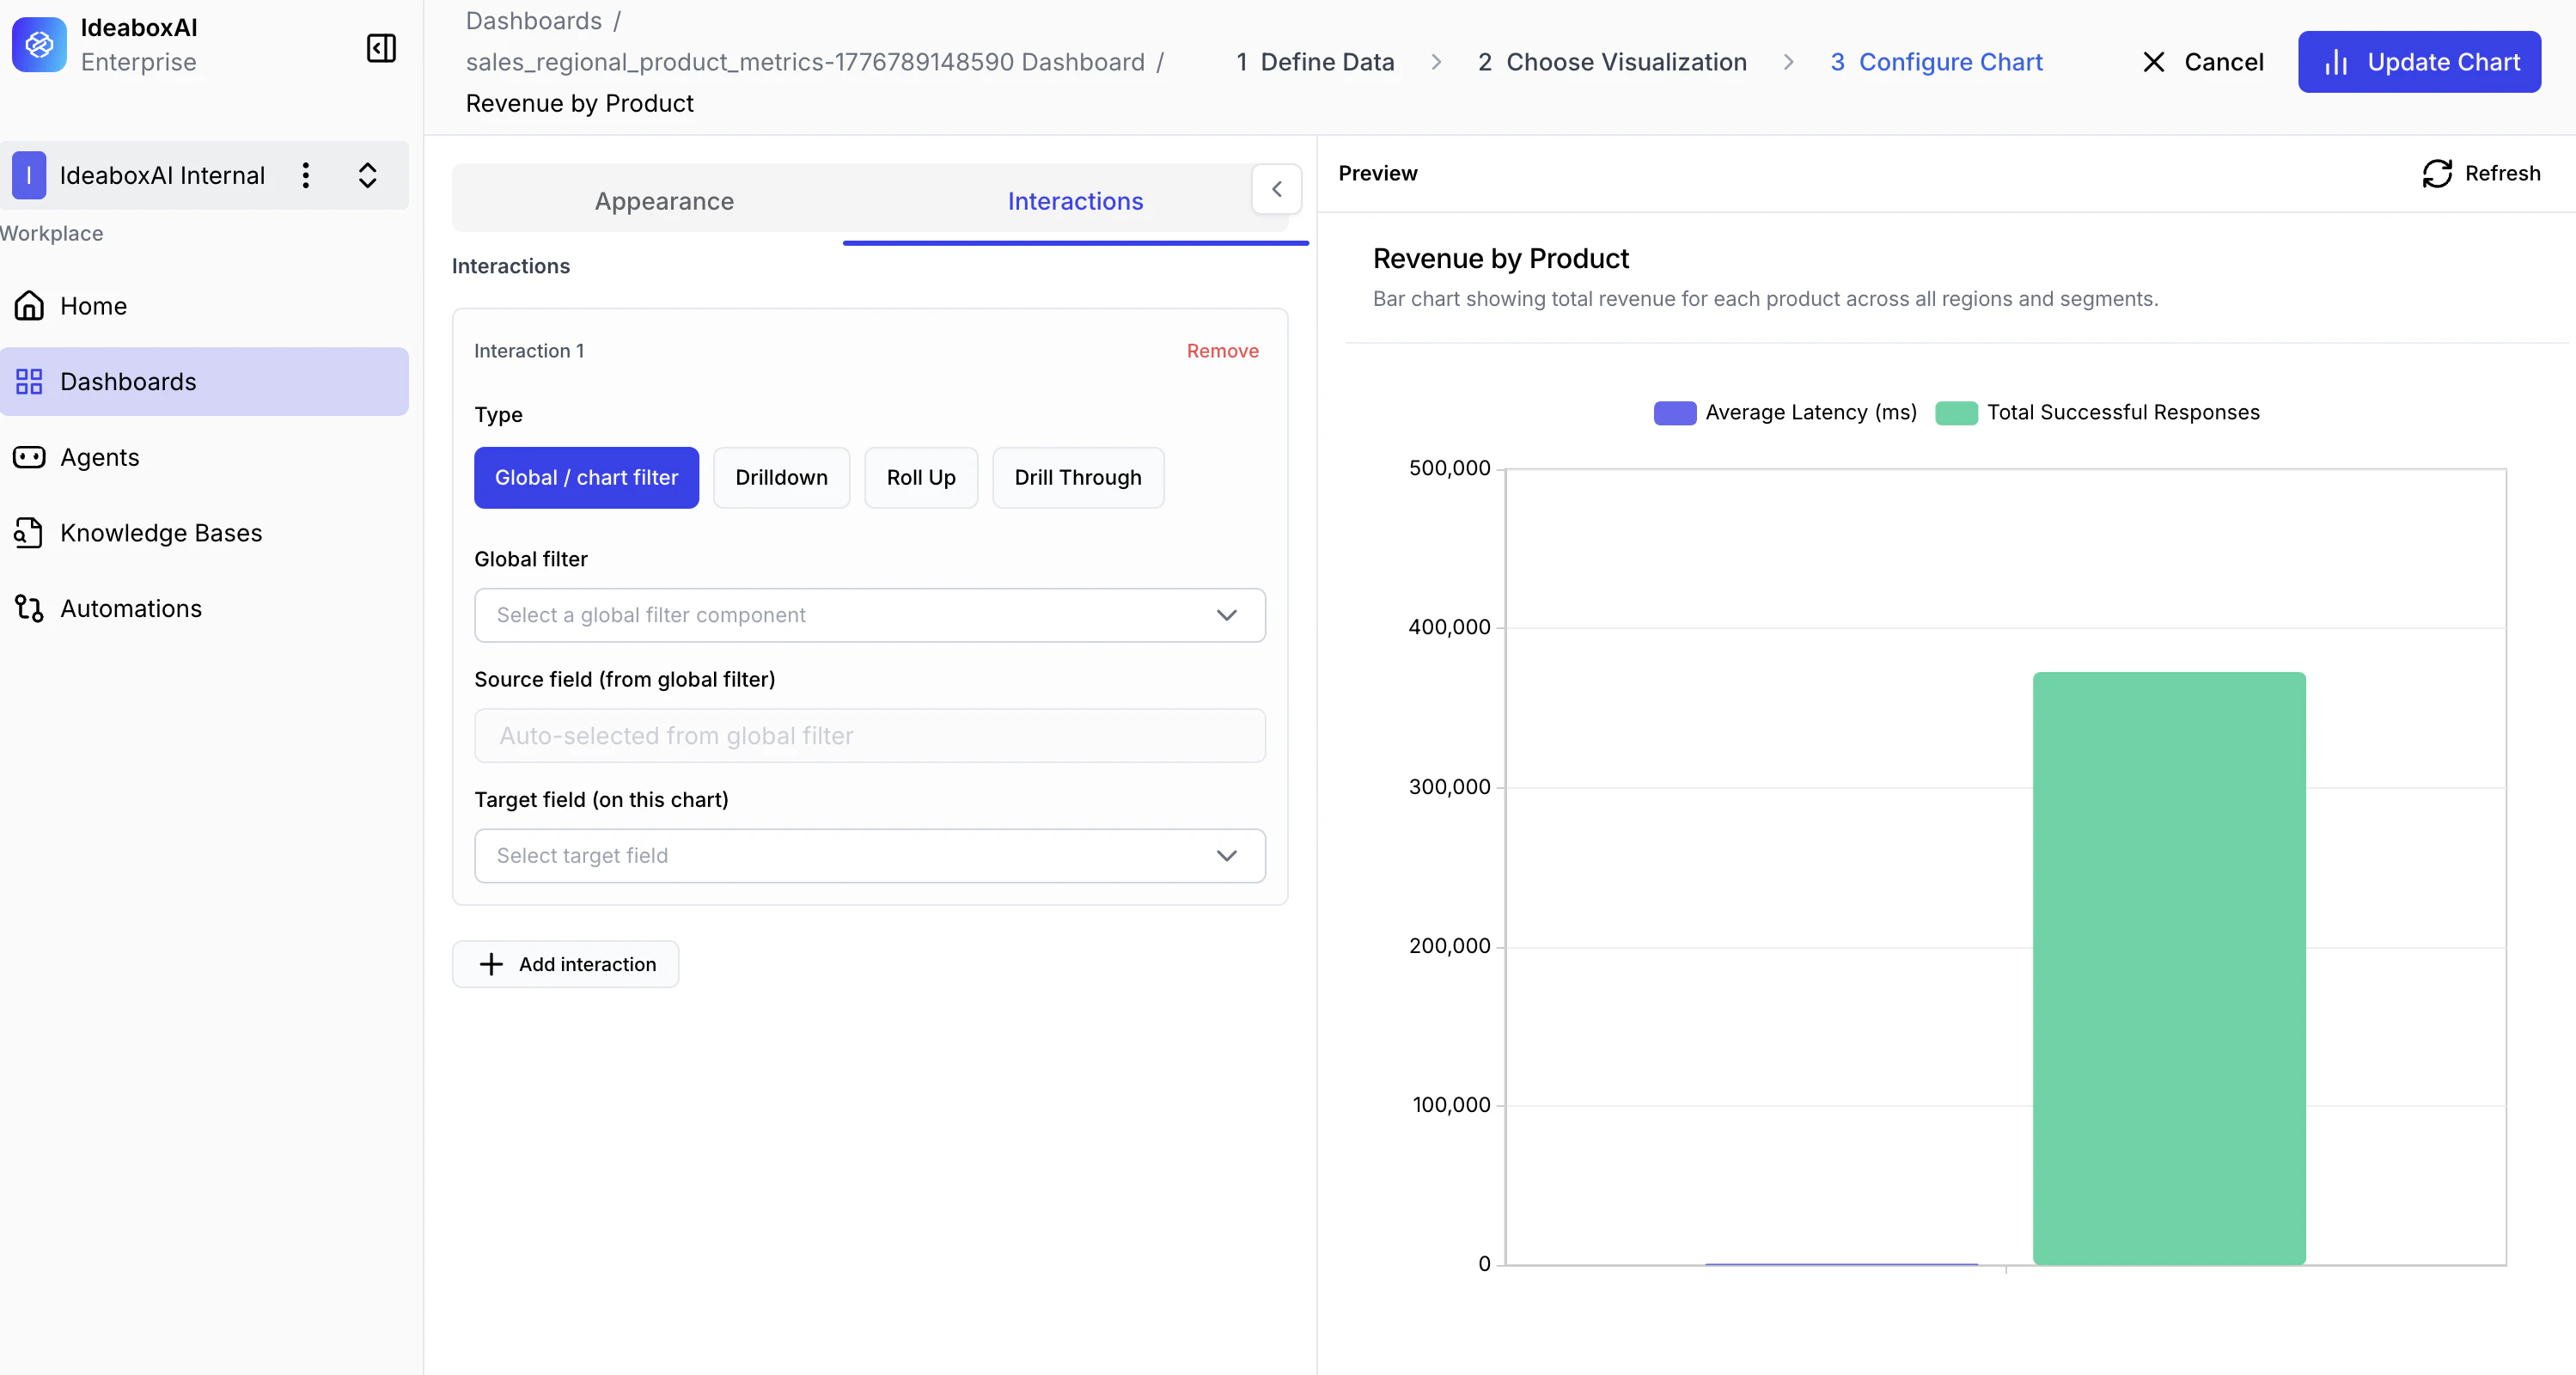
Global / Chart Filter
Link this chart to a global filter or another chart so that filtering one updates this chart automatically.- Global Filter — Select the global filter component to apply.
- Source Field — The field from the filter.
- Target Field — The matching field in this chart.
Roll Up
Let users aggregate data by clicking a data point to move from detailed to summarised views.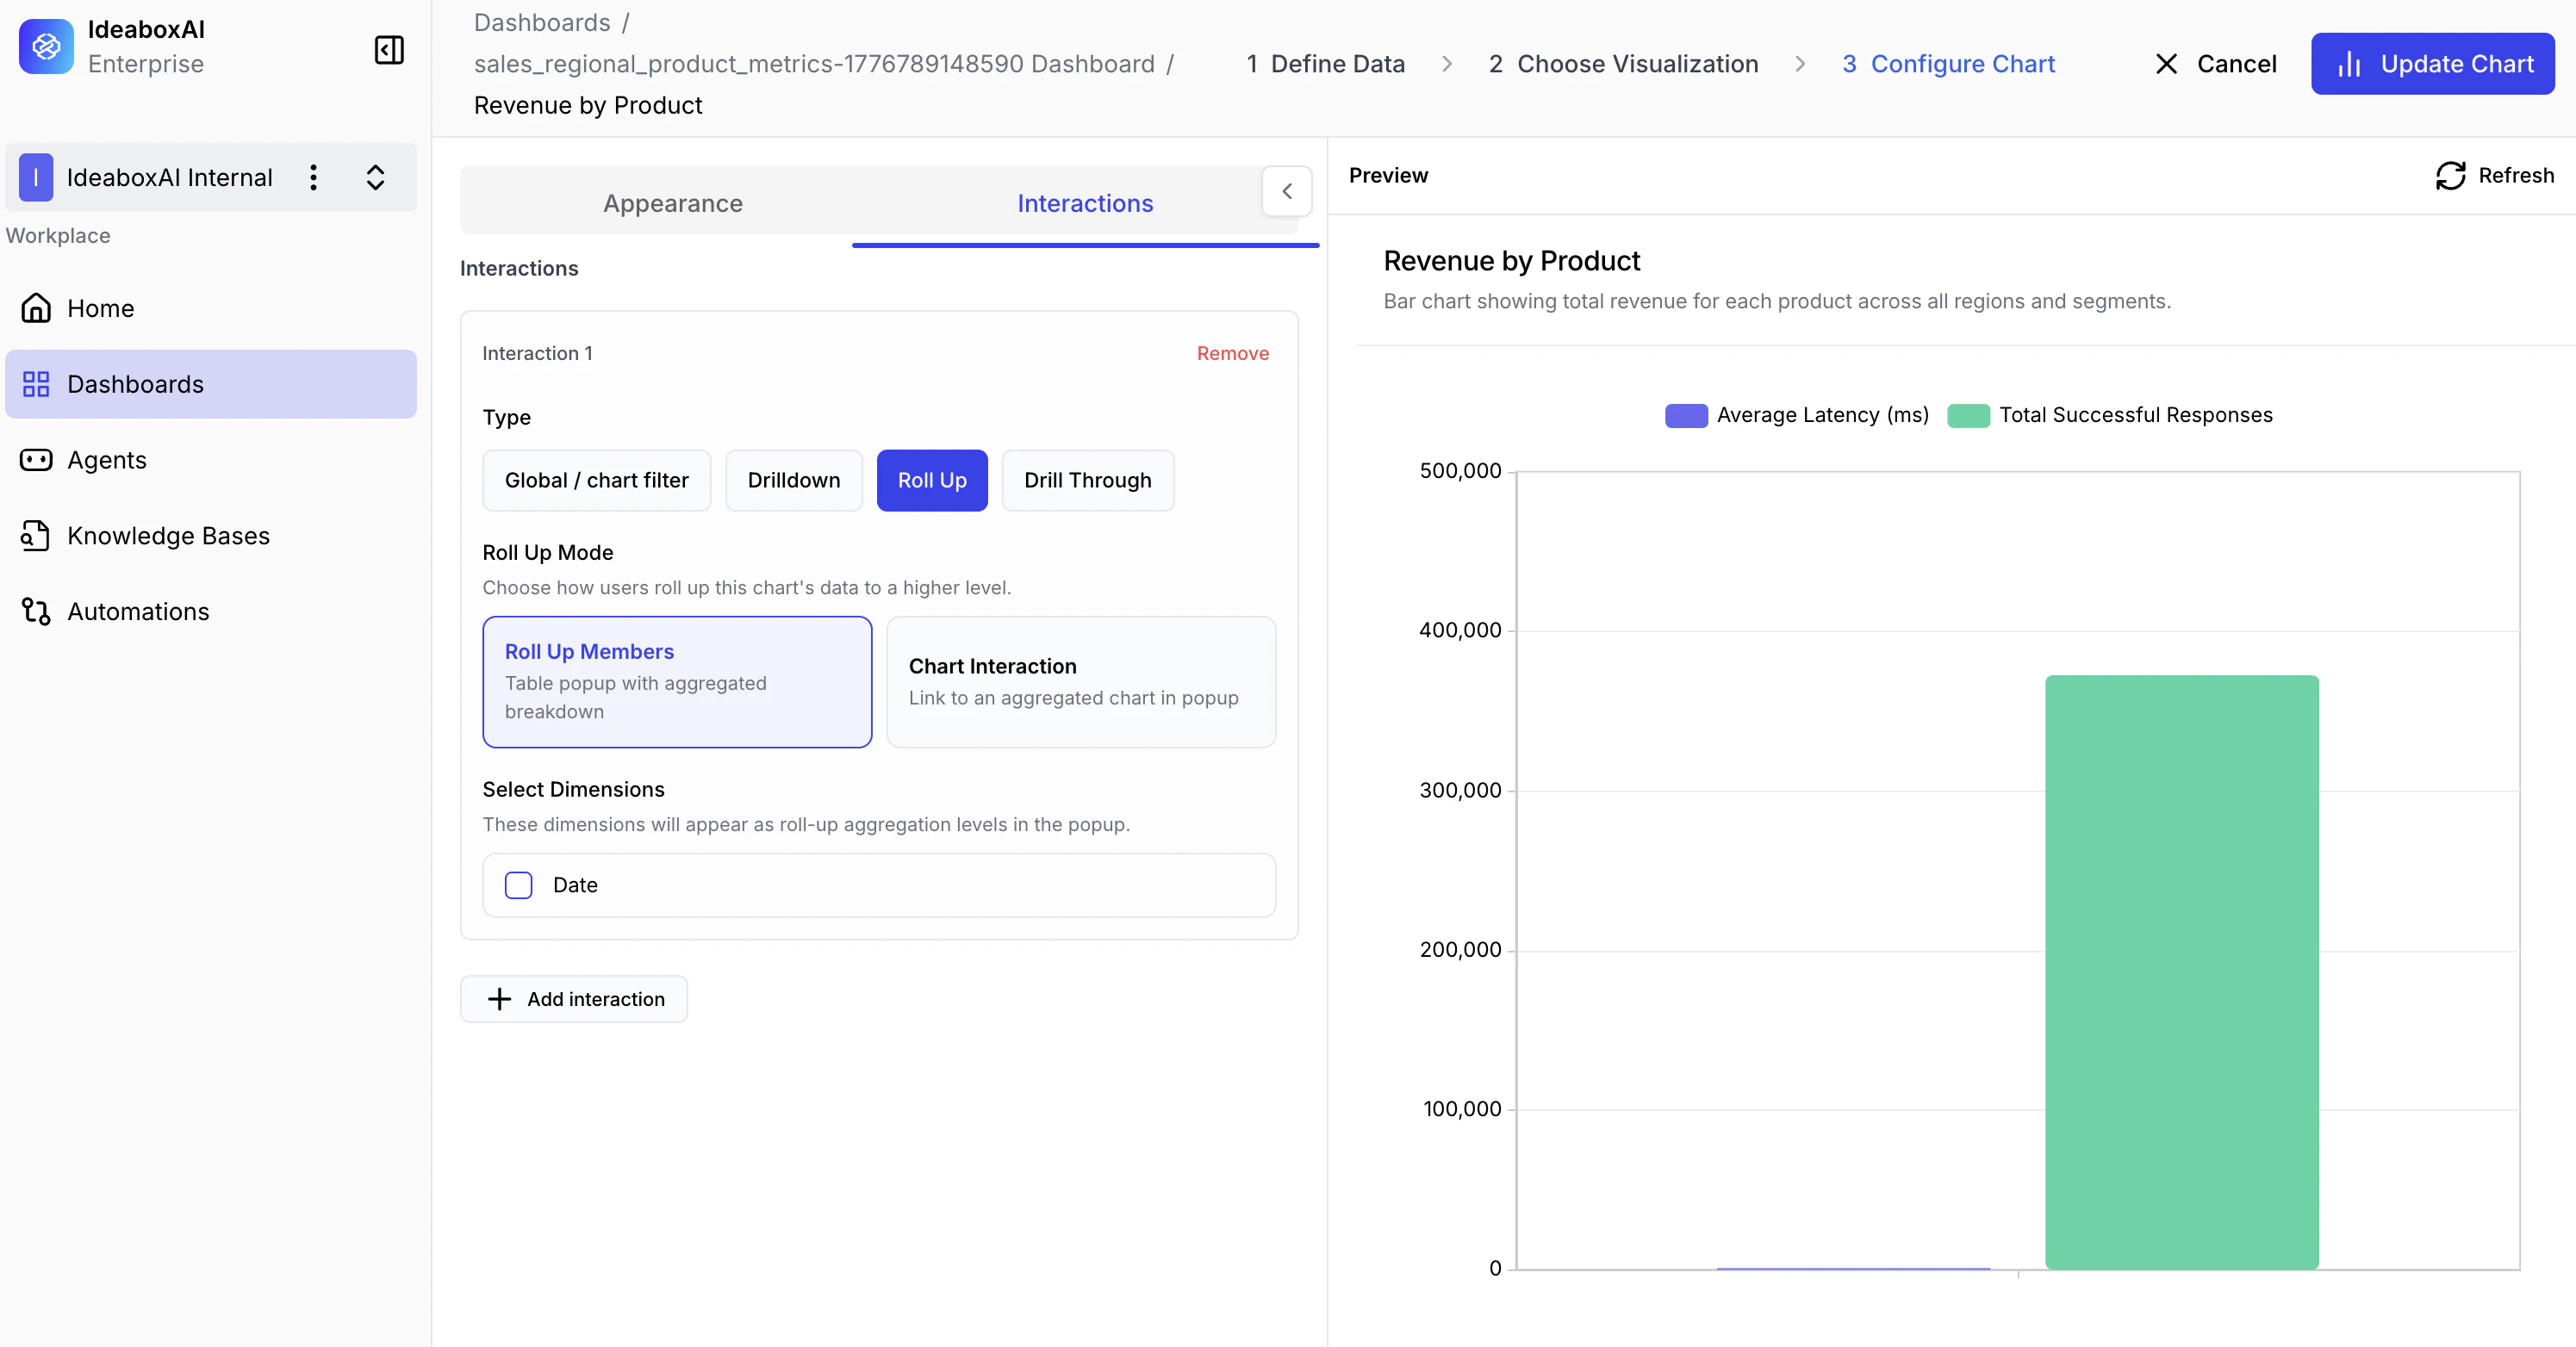
- Roll Up Members — Select the dimensions for the hierarchy (e.g., Date → Month → Year).
- Chart Interaction — Optionally link to another chart that shows the aggregated data.
Drilldown
Let users click a data point to navigate from a summary view to a more detailed chart.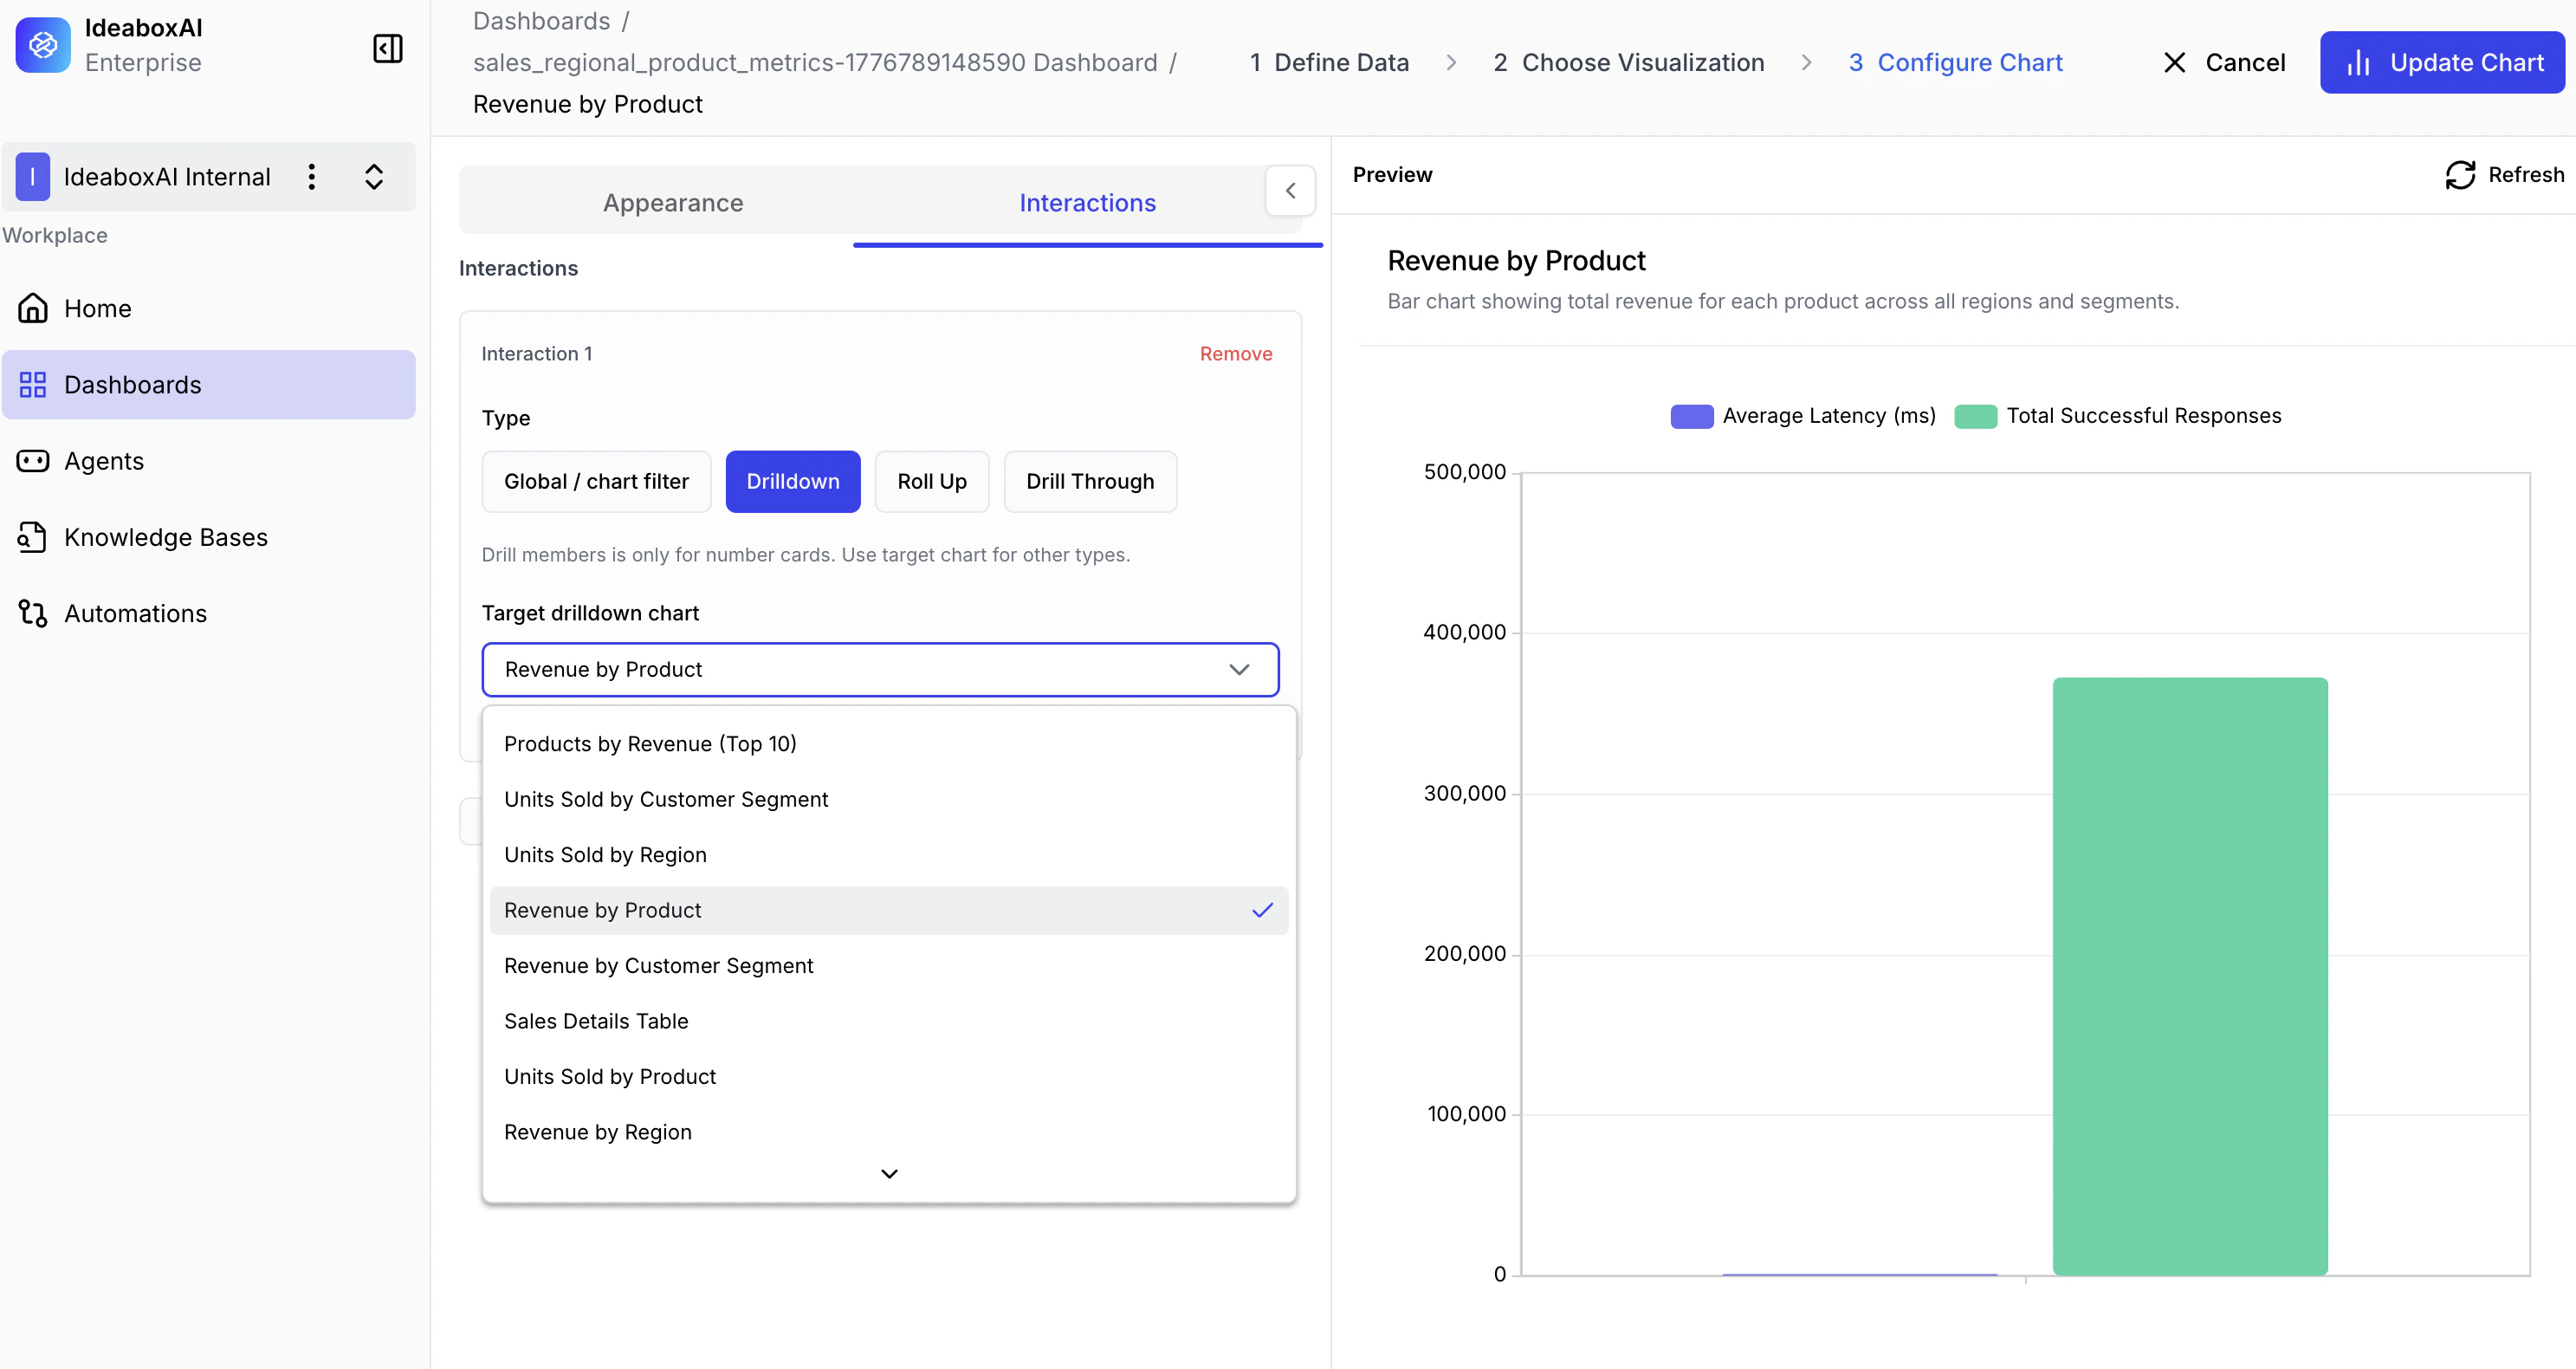
- Target Drilldown Chart — Select which chart to navigate to when a data point is clicked.
- Drill members — Configure which dimensions trigger the drilldown.
Drill Through
Display the underlying transaction-level records in a popup table when a user clicks a data point.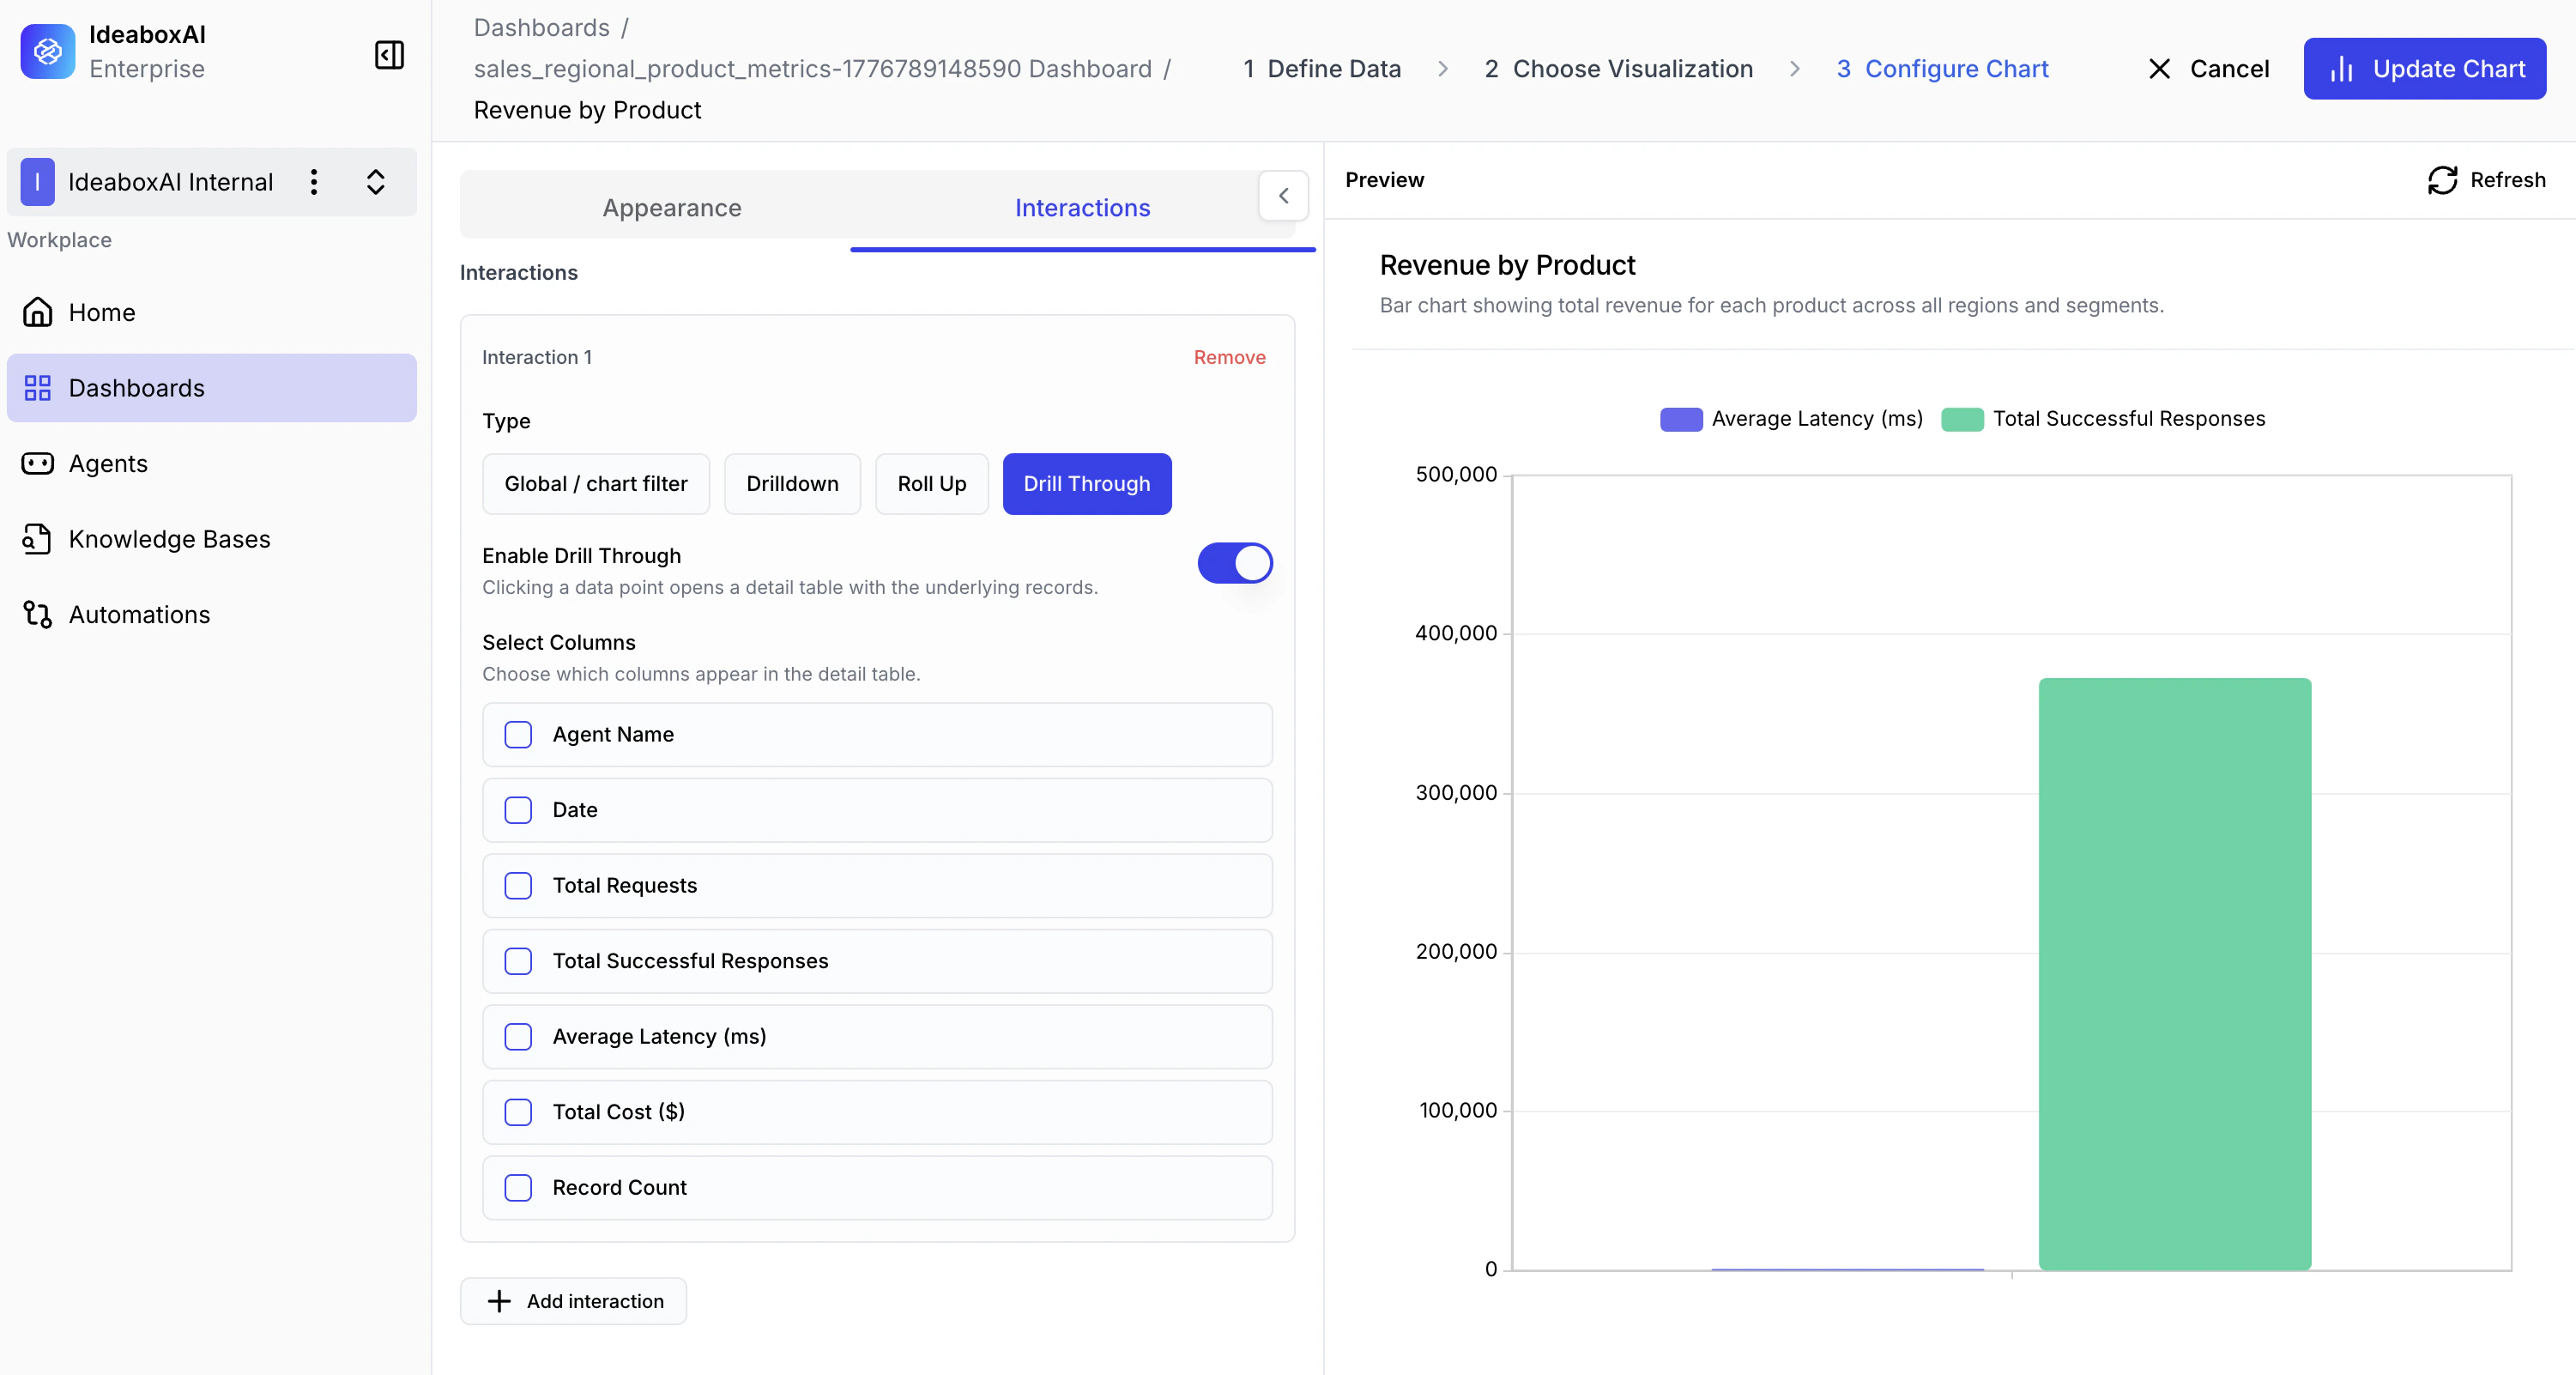
- Enable Drill Through — Toggle to activate drill-through on this chart.
- Select Columns — Choose which fields appear in the detail table (e.g., Agent Name, Date, Total Requests).
Use Drilldown for hierarchical exploration (e.g., Region → Country → City). Use Drill Through when users need to inspect individual records behind an aggregate value, such as the transactions behind a revenue total.