The Dashboard Agent is a built-in AI assistant that lets you interact with your dashboard data using natural language. You can ask questions, request new visualisations, and get contextual guidance without leaving the dashboard.Documentation Index
Fetch the complete documentation index at: https://docs.ideaboxai.com/llms.txt
Use this file to discover all available pages before exploring further.
Opening the AI Assistant
Click the assistant icon in the top-right corner of any dashboard. The chat panel slides open on the right side of the screen.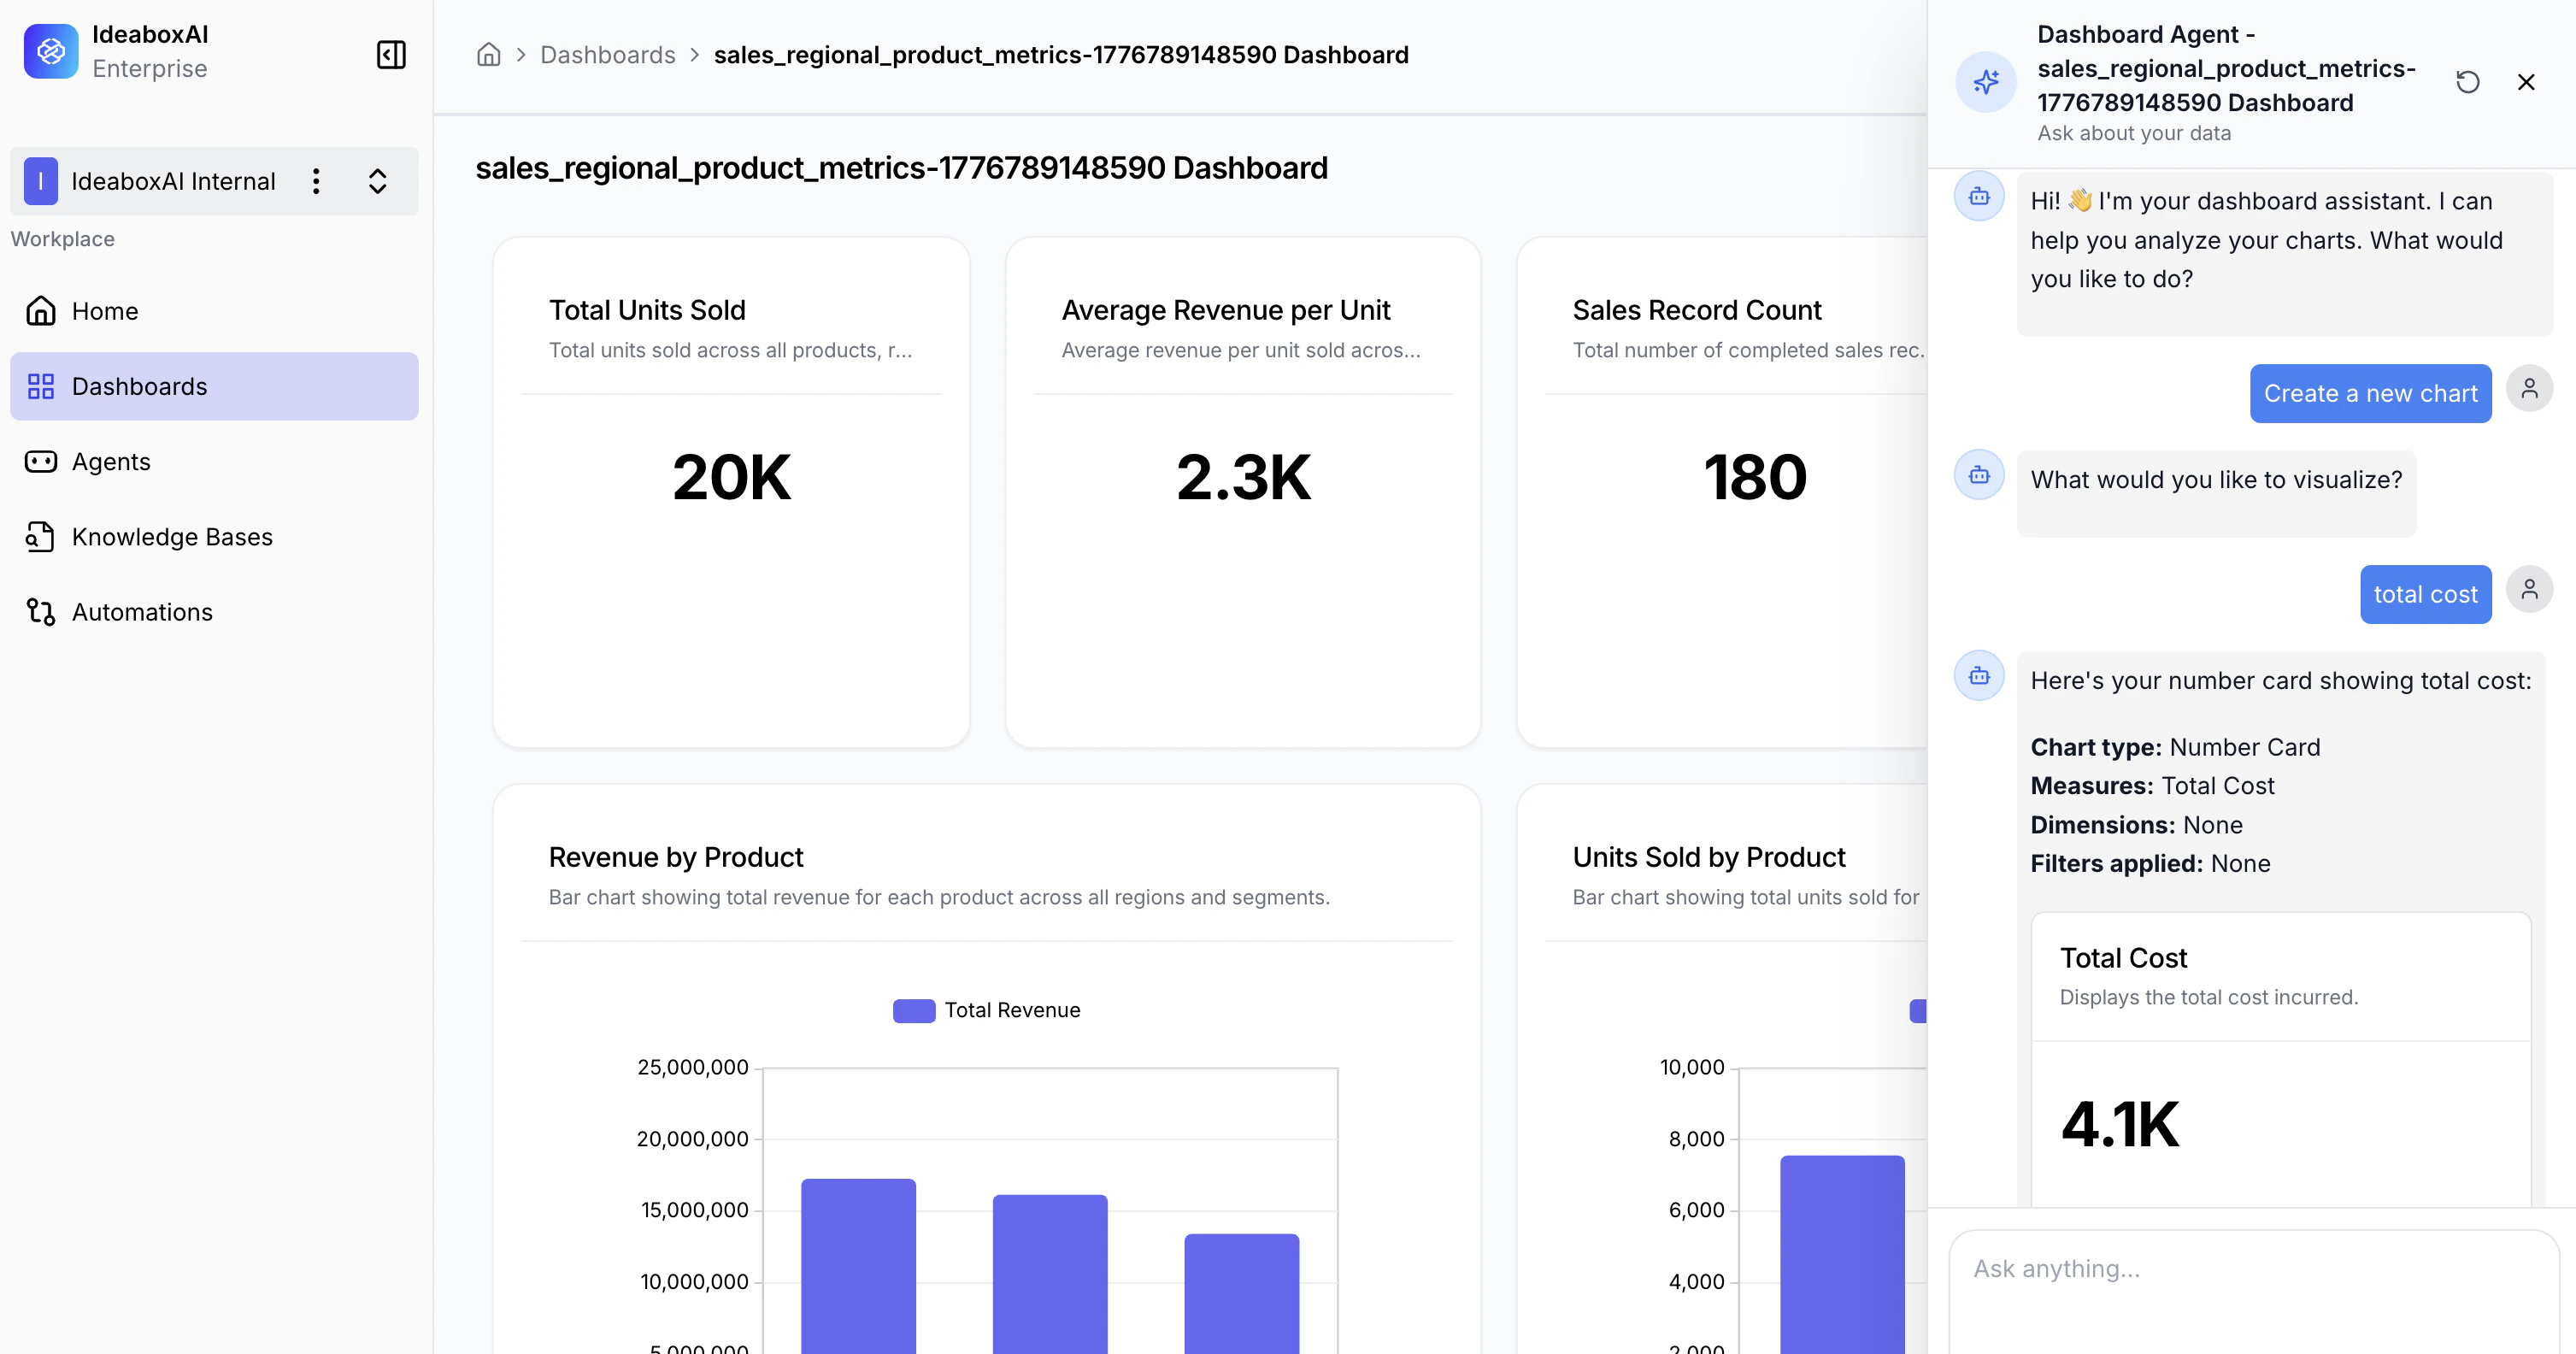
What the AI Assistant can do
| Capability | Description |
|---|---|
| Data Analysis | Ask questions about your charts and metrics. The assistant provides summaries, insights, and business context. |
| Chart Creation | Request new visualisations using natural language. The assistant guides you through configuration. |
| Chart Details | Click on any chart suggestion to view detailed information — chart type, measures, dimensions, and filters. |
| Open Questions | Ask anything about your data or request dashboard modifications using the input field at the bottom. |
Example queries
Use natural language to interact with your data:- “What’s the total revenue by region this quarter?”
- “Create a pie chart of sales by product category.”
- “Which product line has the highest return rate?”
- “Show me a bar chart comparing monthly orders for the last 6 months.”
Creating a chart with the assistant
- Type a request such as “Create a chart showing monthly revenue by region.”
- The assistant suggests a chart configuration with type, measures, and dimensions.
- Click on the suggestion to review the details.
- Confirm to add the chart to your dashboard.
Be specific in your queries — include the metric, dimension, and chart type you want. For example, “Create a bar chart of revenue by product for Q1” produces better results than “show me sales.”