
Documentation Index

Fetch the complete documentation index at: https://docs.ideaboxai.com/llms.txt

Use this file to discover all available pages before exploring further.

Cubes are analytical models built on top of structured data. They define the measures you want to calculate, the dimensions you want to group and filter by, and the SQL logic that generates the data. This guide walks you through creating cubes and executing queries.

Understanding cubes

A cube defines three things.
ComponentDescriptionExample
MeasuresMetrics to calculate.Total revenue, average price, record count.
DimensionsAttributes to group or filter by.Date, category, region, status.
SQL LogicThe underlying query that generates the cube data.A SELECT statement joining relevant tables.

Access the cube configuration interface

In the structured knowledge base view, the cube interface shows:
  • A list of existing cubes in the left panel.
  • The measures and dimensions of the selected cube.
  • Query execution controls and a result preview.
Cube configuration interface showing a list of cubes, measures and dimensions for the selected cube, and query execution controls with result preview. Click Add Cube to create a new one.
Ensure the underlying datasets are already validated and available before creating cubes. Follow consistent naming conventions to simplify discoverability.

Create a new cube

Add Cube modal showing two creation approaches: AI Generate and Manual Query. The Add Cube modal provides two approaches. Let AI automatically generate the base SQL, measures, and dimensions from a natural language description.
1

Enter a cube name

Provide a unique, descriptive identifier, for example ORDER_SUMMARY or MONTHLY_REVENUE.
2

Write a description

A concise explanation of the cube’s analytical purpose.
3

Describe the analytics in natural language

Tell the AI what you want to analyse, for example “Show total revenue by region and product category, with month-over-month trends.”
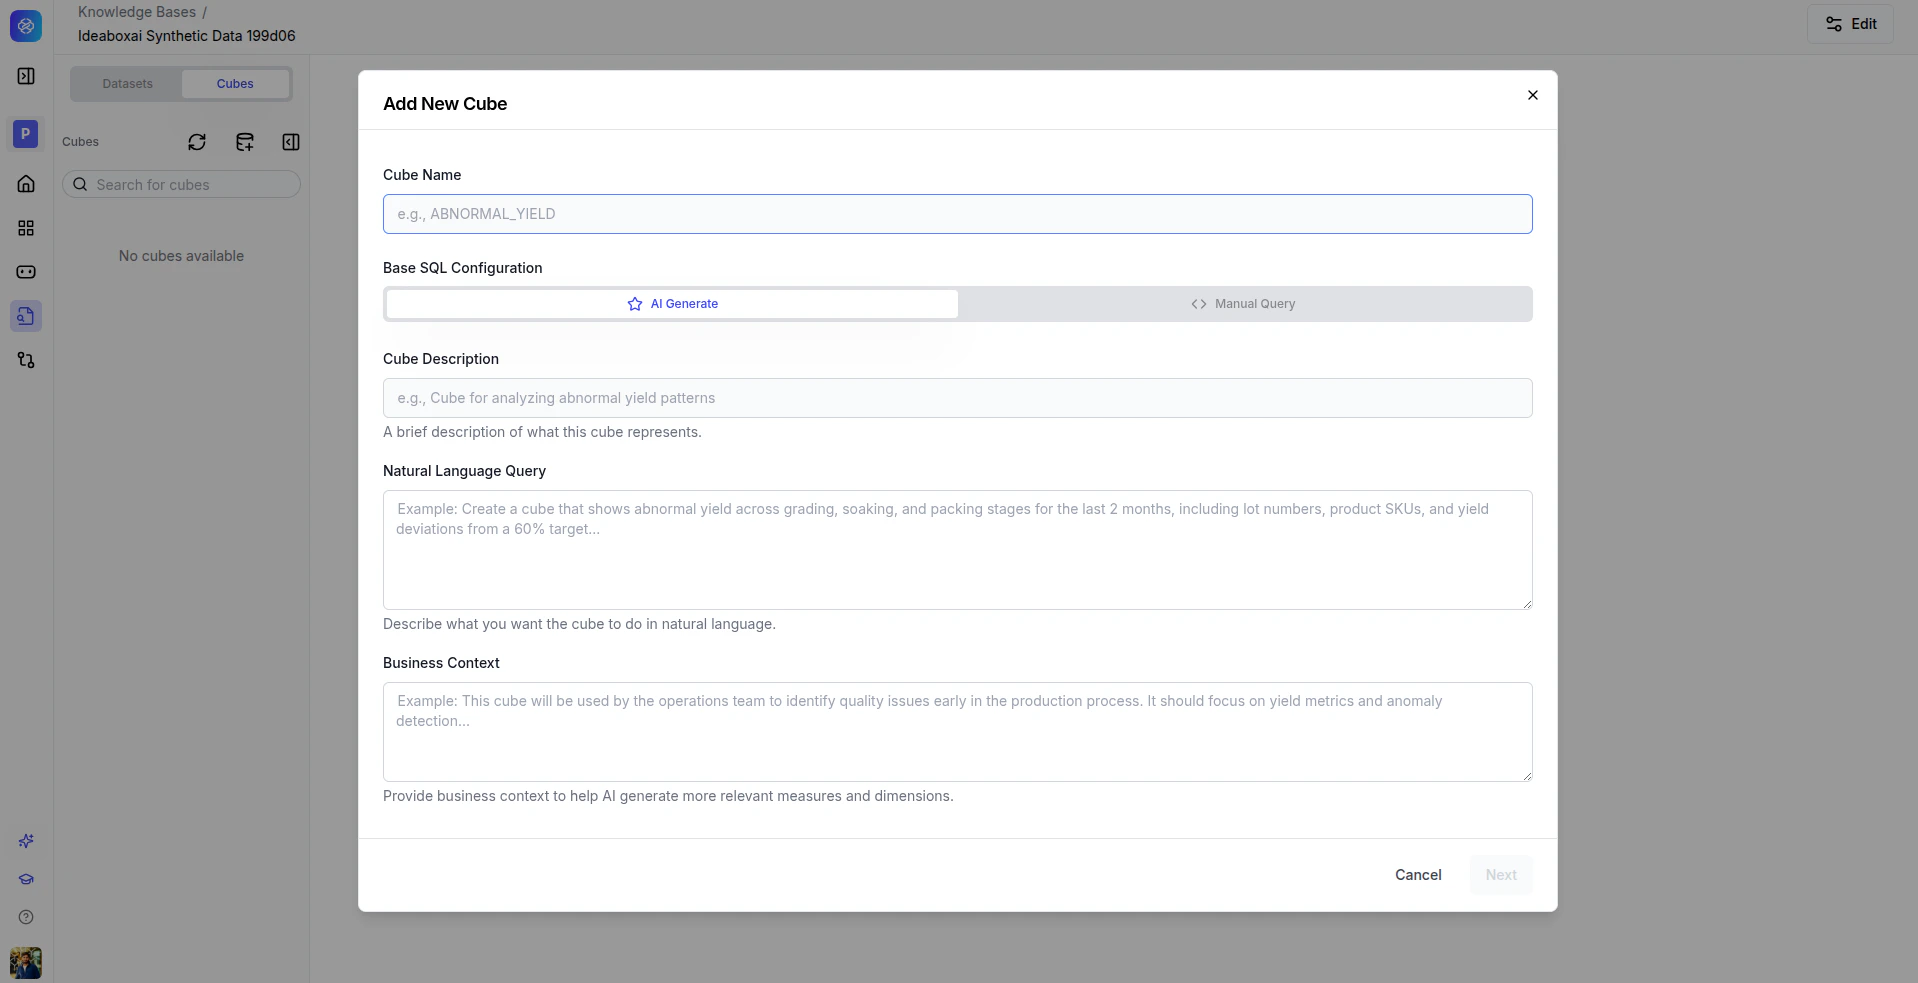
4

Provide business context

Add domain context so the AI can make better decisions about joins, filters, and metric definitions.
AI Generate flow for cube creation showing fields for Cube Name, Description, Natural Language Query, and Business Context, with AI-generated SQL and measures below. The AI analyses your datasets and context to generate optimized SQL with appropriate measures and dimensions.

Manual query

For advanced users who want to author SQL directly.
1

Enter a cube name

Provide a unique identifier for the cube.
2

Write the base SQL

Author a custom SQL query that defines the cube’s data source.
Manual Query flow for cube creation showing the Cube Name field and a SQL editor for writing custom queries.
Prefer AI Generate for rapid prototyping and exploratory analytics. Use Manual Query for performance-critical or highly customized analytical logic.
Best practices
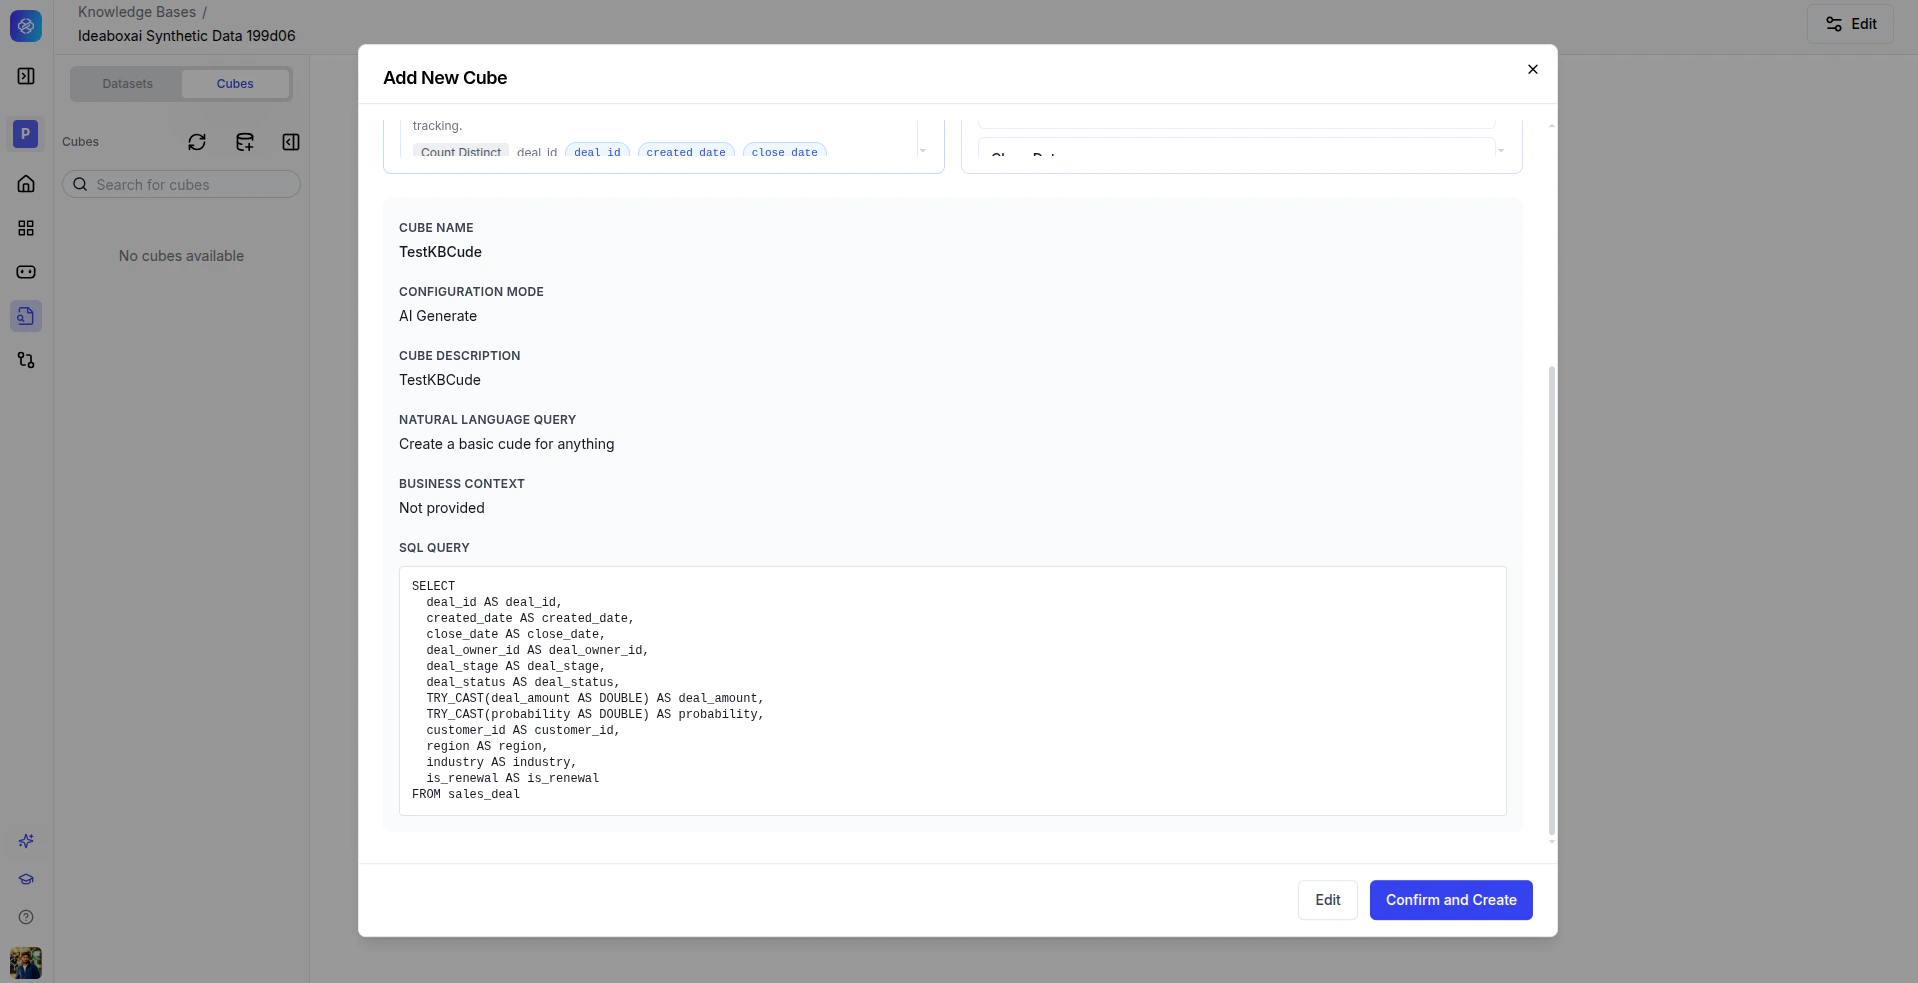
  • Clearly document the business intent in the description and context fields.
  • Test generated SQL before deploying to production workflows.
  • Start with simple cubes and iterate based on feedback.

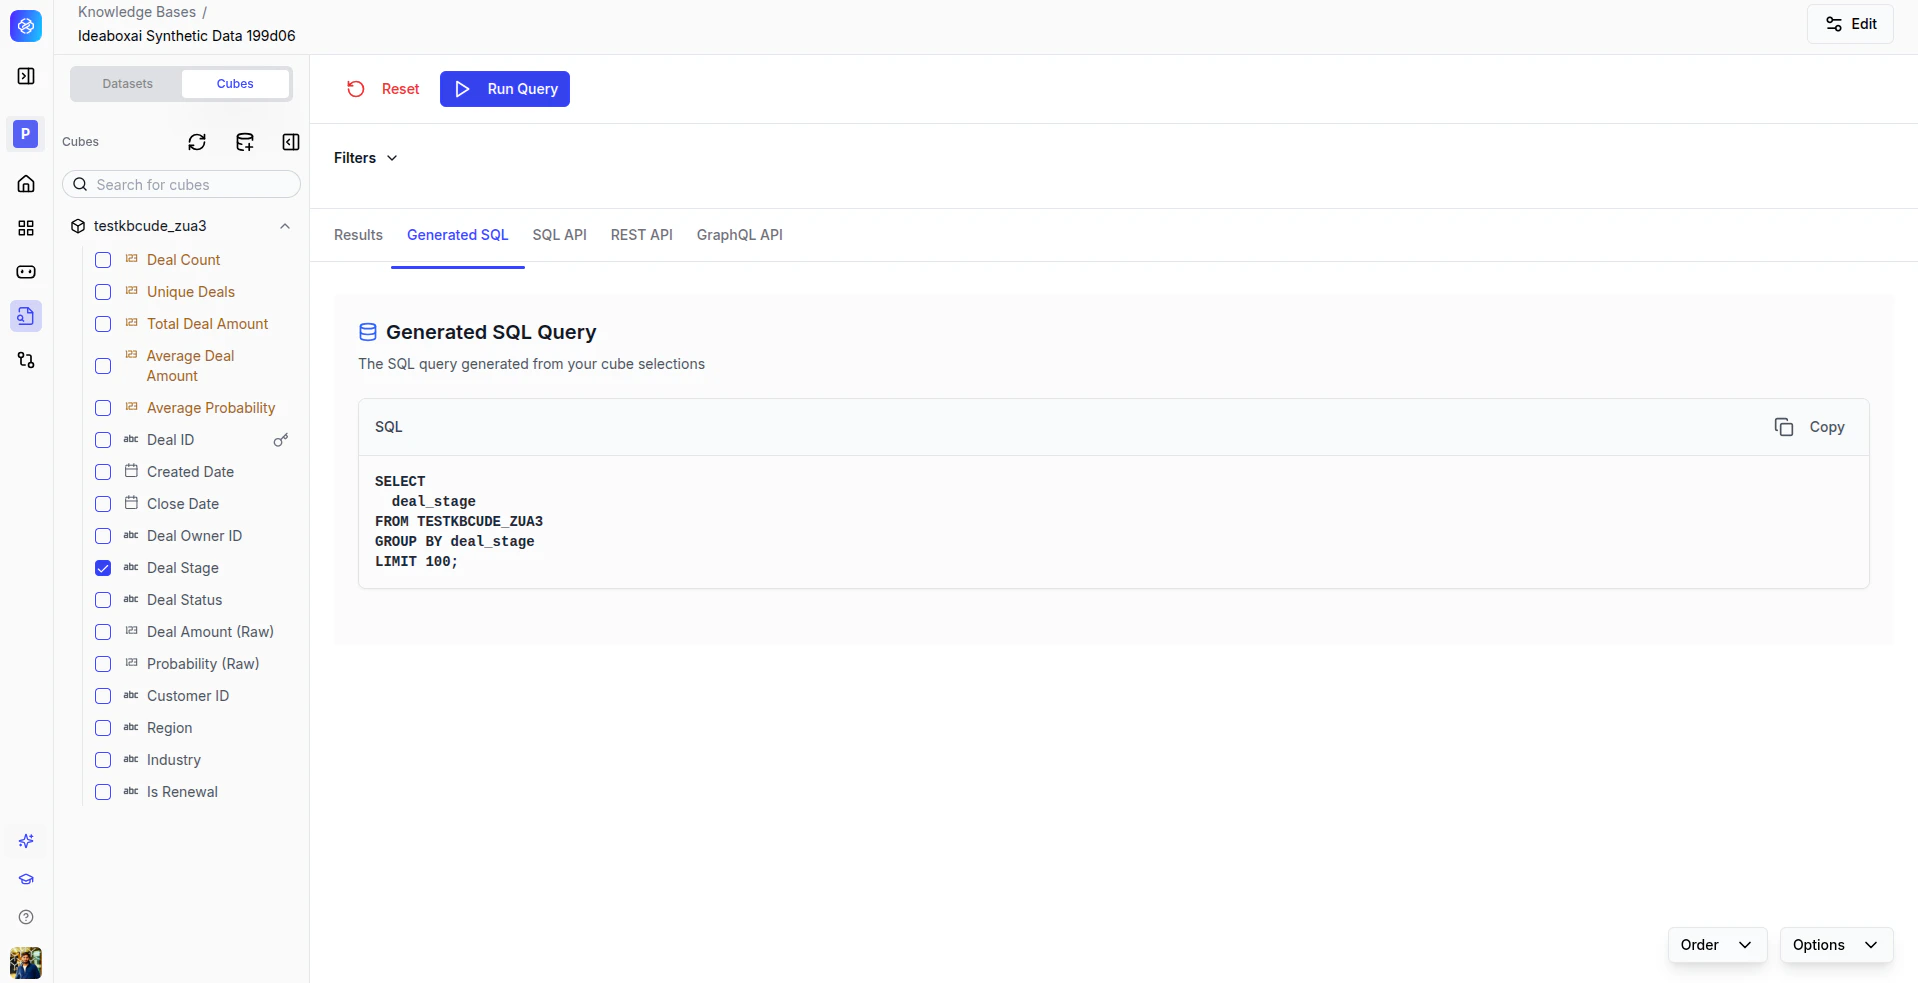
Execute queries and view results

Once a cube is created, you can query it using the cube selection panel.
1

Select measures

Choose the metrics you want to calculate.
2

Select dimensions

Choose how to group and filter the results.
3

Apply filters

Narrow the results to a specific subset of data.
4

Run the query

Click Run Query to execute.
Cube selection panel showing measures and dimensions dropdowns, filter controls, Run Query button, and results table.

View results in multiple formats

Query results are available in several formats via tabs.
TabDescription
ResultsInteractive table or chart view of the query output.
Generated SQLThe SQL query powering the results.
SQL APIAn endpoint for SQL-based integrations.
REST APIA RESTful endpoint for application integrations.
GraphQL APIA GraphQL endpoint for data fetching.
Best practices
  • Start with a limited number of dimensions for better performance.
  • Reuse generated API endpoints instead of re-running UI queries.
  • Validate results against source systems for critical analytics.
  • Export and share results with your team.